World trade is expected to grow by a modest 4.7% in 2014 and at a slightly faster rate of 5.3% in 2015
Main points:
- The trade forecast for 2014 has been upgraded to 4.7% from 4.5%, still below the 20-year average of 5.3% (1983–2013). A 5.3% increase in trade is anticipated for 2015.
- Risks to the forecast have eased in developed economies but risen in developing countries, as the end of quantitative easing has increased financial market volatility.
- World merchandise trade grew 2.1% in 2013 in volume terms, very close to the 2.3% increase from the previous year.
- Developing economies trade flows turned negative in the middle of 2013, as exports and imports each fell 1% between the first half and the second. Developed economies staged a modest recovery, as exports and imports rose 1% and 1.5%, respectively, during the same period.
Analysis of the world trade and GDP (2005-2015)
Although the 2014 forecast of 4.7% is more than double the 2.1% increase of last year, it remains below the 20-year average of 5.3%. For the past two years, growth has averaged only 2.2%.
The sluggish pace of trade growth in 2013 was due to a combination of flat import demand in developed economies ( 0.2%) and moderate import growth in developing economies1(4.4%). On the export side, both developed and developing economies only managed to record small, positive increases (1.5% for developed economies, 3.3% for developing economies).
It’s clear that trade is going to improve as the world economy improves. However, WTO Members are planing incentives to improve this “automatic” solution [1].
As an example of the actively support trade growth by updating the rules and reaching new trade agreements is the deal in Bali last December 2013 -WTO Trade Facilitation Agreement in Bali [2].
Chart1: Growth in the volume of world merchandise trade and GDP, 2005-15a
Annual % change

a Figures for 2013 and 2014 are projections.
Source: WTO Secretariat.
Several factors contributed to the weakness of trade and output in 2013, including the lingering impact of the EU recession, high unemployment in euro area economies (Germany being a notable exception), and uncertainty about the timing of the Federal Reserve’s winding down of its monetary stimulus in the United States. The latter contributed to financial volatility in developing economies in the second half of 2013, particularly in certain “emerging” economies with large current account imbalances [3] [4].
The preliminary estimate of 2.1% for world trade growth in 2013 refers to the average of merchandise exports and imports in volume terms, i.e. adjusted to account for differences in inflation and exchange rates across countries. This figure is slightly lower than the WTO’s most recent forecast of 2.5% for 2013, issued last September. The main reason for the divergence was a stronger than expected decline in developing economies’ trade flows in the second half of last year. For the second consecutive year, world trade has grown at roughly the same rate as world GDP (gross domestic product, a measure of countries’ economic output) at market exchange rates, rather than twice as fast, as is normally the case (Chart 1).
Recent business surveys and industrial production data point to a firming up growth in the United States and Europe in early 2016 and 2017. The gradual improvement of US employment data has allowed the Federal Reserve to proceed with its planned “tapering”, of their third round of quantitative easing (“QE3”) [5]. The outlook for the European Union has also improved, although growth there will remain uneven as long as peripheral EU economies continue to under-perform core ones [6]. Output growth in Japan should be slightly lower in 2014, 2015 and 2016 as planned fiscal consolidation is implemented [7]. Finally, despite having hit a soft patch recently, developing economies (including China) should continue to outpace developed economies in terms of GDP and trade growth in the coming year, but some could encounter setbacks, particularly those most exposed to the recalibration of monetary policy in developed countries.
In 2014, the dollar value of world merchandise exports rose 2.1% to $18.8 trillion. This growth rate was slightly less than the WTO’s export volume growth estimate for the year (+2.4%), which implies that export prices declined slightly from one year to the next. Meanwhile, the value of world commercial services exports rose 5.5% to $4.6 trillion.
The trade forecast for 2015 is premised on an assumption of 2.8% growth in world GDP growth at market exchange rates, while the forecast for 2016 assumes output growth of 3.3%. [8]. Risks to the trade forecast are still mostly on the downside, but there is some upside potential, particularly since trade in developed economies is starting from a low base. However, volatility is likely to be a defining feature of 2015 as monetary policy in developed economies becomes less accommodation.
Some developed economy risks factors have receded considerably since last year, including the sovereign debt crisis in Europe and fiscal brinkmanship between the executive and legislative branches of government in the United States. Developing economies are now the focus of several gathering risks [9], including large current account deficits (e.g. India [10], Turkey [11]), currency crises (Argentina [12]), over-investment in productive capacity, and re-balancing economies to rely more on domestic consumption and less on external demand.
Geopolitical risks have introduced an additional element of uncertainty to the forecast. Civil conflicts and territorial disputes in the Middle East, Asia and Eastern Europe could provoke higher energy prices and disrupt trade flows if they escalate [13]. However, since the timing and impact of these kinds of risks are inherently unpredictable, they are not considered directly in our forecasts.
More details on trade developments and predictions based on the 2013 recovery
The WTO and UNCTAD jointly produce a variety of short-term trade statistics, including seasonally-adjusted quarterly merchandise trade volume indices. These are shown in Chart 2 for the United States, the European Union, Japan and developing Asia (which includes China) [14].
Chart 2 — Quarterly merchandise trade flows of selected economies, 2010Q1-2013Q4
Seasonally adjusted volume indices, 2010Q1=100
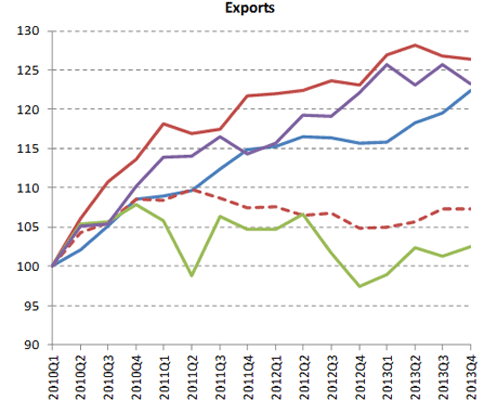

Source: WTO Short-term trade statistics.
After a flat first quarter, US exports grew steadily for the remainder of 2013. In contrast, exports from the Europe Union to the rest of the world (i.e. extra-EU exports) were strongest in the first quarter but weakened and turned negative over the course of the year. Trade between EU countries (i.e. intra-EU exports) rallied slightly in the third quarter but stalled in other periods. Japan saw its exports increase in three out of four quarters in 2013, starting from a low base. Finally, exports from developing Asia trateted water, alternating between positive and negative but trending flat.
Overall, exports in the second half of the year were up for the United States (3.3%), intra EU (2.0%), and Japan (1.2%), while developing Asia was flat (0.0%) and extra EU slightly negative (-1.5%).
On the import side, extra-EU trade trended down throughout the year, sapping global demand. (The story for intra-EU imports is the same as for intra-EU exports, see above.) Meanwhile, US and Japanese imports were generally rising, and developing Asia was mostly flat, only turning negative in the fourth quarter.
In the second half, import demand was improving in some large markets (+2.2% for the US, +1.8% for intra-EU, +0.2% for extra-EU, and +3.3% for Japan), and was slightly negative in developing Asia (0.2%). However, exporters will find little relief until EU imports recover substantially from their current depressed state. (EU merchandise imports represent 32% of world imports including intra-EU trade, and 15% of world imports excluding it.)
Although not shown in Chart 2, quarterly exports and imports of developing economies in total turned negative in the second half of last year, with exports and imports each falling around 2% between the second and fourth quarters. South and Central America’s trade flows were particularly affected (the region’s exports declined by 3% and its imports contracted by 5% during the same period) but other natural resource exporting regions were hit hard as well. However, the declines in developing regions were roughly cancelled by the rising trend for developed economies.
For the second time in two years, merchandise trade has grown more slowly than one would expect given the growth of the world economy as measured by GDP. Although trade can grow faster or more slowly than output in any given year, since the 1990s it has tended to grow about twice as fast as GDP when measured at market exchange rates. In 2012 trade growth fell to the same rate as GDP, and they remained at matching rates in 2013, prompting analysts to question whether the previous relationship continued to hold.
Chart 3 shows 10-year moving averages of world trade growth, world GDP growth and their ratio. This ratio peaked at 2.4 in 2000 but has since fallen to 1.7 in 2013. Historically, trade has tended to contract when world output has slowed, only to rebound sharply afterwards. Structural factors (e.g. the spread of supply chains, the product composition of world trade, subtle protectionism, etc.) may have played a role in the declining ratio. However, given the number and severity of global slowdowns in recent years, the explanation may simply be cyclical. It is too soon to say whether something like a 2:1 relationship between trade growth and GDP growth will reassert itself once the global recovery gains traction, but this variable will bear watching in the future.
Chart 3: 10-year moving average of world trade, GDP and trade/GDP, 1990-2015
Average annual % change (left) and ratio (right)
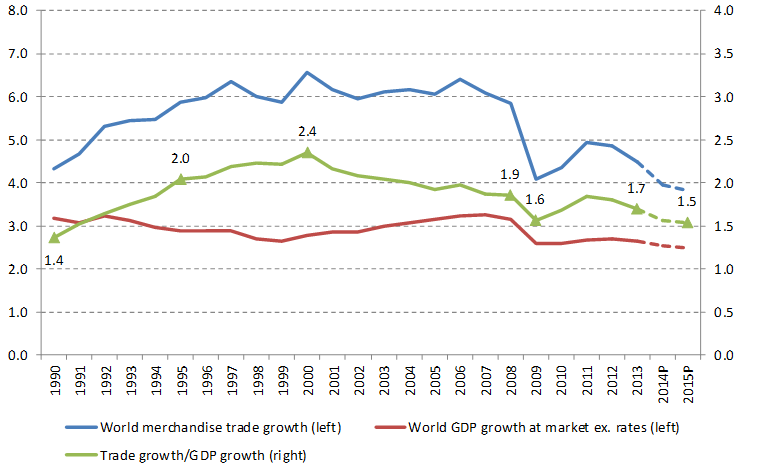
a Figures for 2014 and 2015 are projections Source: WTO Secretariat
Additional perspectives and forecast
The WTO’s forecast of 4.7% growth in world merchandise trade for 201 is below the average rate of 5.3% for the last 20 years (1993–2013) and also below the pre-crisis average rate of 6.0% for 1990–2008 (Chart 4). In addition to creating a permanent shift downward in the level of trade, the global recession of 2008-09 may have reduced its average growth rate as well. The average rate of trade expansion in the three years since 2010 is 3.42%. Forecasts for 2015 and 2016, if correct, would raise the average to 4.2%, but this rate is insufficient to narrow the existing gap.
Chart 4: Volume of world merchandise exports, 1990-2015a
Indices, 1990=100
a Figures for 2014 and 2015 are projections. Source: WTO Secretariat
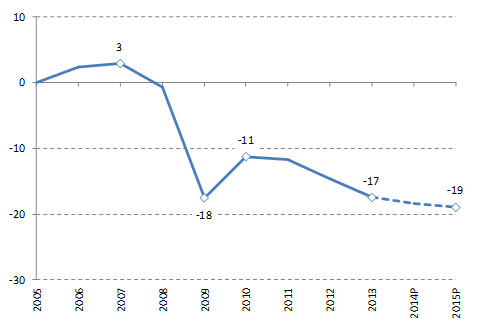
The divergence between the pre-crisis trend and current levels of world trade continues to widen. This gap was at 17.0% of the trend level in 2013, stood at 19% by 2014 and will rise to 19.5% in 2015 if our projections are realized, which would place world trade further below its the pre-crisis trend than it was in 2009 during what economists have called the “great trade collapse” (Chart 5).
In 2012 the EU recession had a significant dampening effect on measured trade volumes due to the large share of the European Union in world trade (around 1/3 for both exports and imports) and to the fact that, by convention, trade between EU countries is counted in world trade totals. In last year’s press release, we estimated that growth in world trade would have been more than a percentage point higher if the EU was treated as a single entity and intra-EU trade was ignored. A similar calculation for 2013 did not result in a substantially higher growth rate (2.7% for world trade excluding intra-EU trade, compared to 2.1% including it) because although trade within the EU remained depressed it was not declining as sharply as last year. However, if EU economies recover faster than expected and trade between them is revitalized, this could cause world trade to surprise on the upside.
Chart 5: Deviation of world merchandise export volumes from pre-crisis trends, 2005-15a
percent
a Figures for 2014 and 2015 are projections. Source: WTO Secretariat
Prospects for 2015 and 2016
Prospects for world trade and output in 2015 and 2016 are better than they have been for some time, but leading economies remain fragile, including some of the most dynamic developing countries that until recently were propping up global demand. Downside risks to trade abound, but significant upside potential also exists, as the US economy seems to be gaining momentum and the European Union appears to have turned a corner. At the same time, developing economies have slowed appreciably, for a variety of reasons both internal and external. Which of these forces is stronger may determine how world trade evolves over the next 1 to 2 years.
In order to provide a more complete picture of the trade outlook, we have produced a detailed forecasts, including breakdowns by geographic region and by level of development (Table 1). Forecasts for North America, South and Central America, Europe and Asia are shown separately, whereas data for Africa, the Middle East and the CIS are aggregated together due to their economic similarity as petroleum exporting regions, and also because statistics for these regions rely more on estimation due to incomplete data.
World merchandise trade is expected to post a 5.3% increase in 2015, with developed economies growing 4.3% and developing economies and the CIS advancing 6.8%. We expect that exports from Asia will grow faster than those from any other region (7.2%). Asia should be followed by North America (4.6%), South and Central America (4.4%), Europe (3.3%), and Other regions (3.1%), an aggregate that includes Africa, CIS and Middle East. Exports will be supported by rising import demand on the part of developed countries as the US economy gains momentum, and by improving economic conditions in Europe. However, the extent of the gains will be limited by the high level of unemployment in European countries and the still considerable amount of slack in the US labour market due to low labour force participation.
On the import side, the 4.7% increase in world trade in 2014 will be split between developed economies growing at 3.4%, and developing economies growing at 6.3%. Asia should also lead all regions in import growth in 2014 (6.4%), followed by Other regions (5.8%), South and Central America (4.1%), North America (3.9%), and finally Europe (3.2%). However, Asian import growth is likely to be unbalanced, with larger gains in China and smaller increases in other developing Asian economies.
Two year forecasts are provisional estimates based on strong assumptions about the medium-term trajectory of gross domestic product (GDP) and should be interpreted with care. Merchandise trade is projected to grow by 5.3% in 2015, with developed and developing economies posting increases of 4.3% and 6.8%, respectively, on the export side, as well as gains of 3.9% and 7.1% on the import side. For the year we expect to see Asia’s exports grow faster than in 2014 (7.2%), followed by those of South and Central America (5.5%), North America (4.5%), Europe (4.3%), and Other regions (4.2%). In 2015, import growth of Asia should accelerate to 7.0%. Other regions will have the second fastest import growth (6.6%) followed by South and Central America (5.2%), North America (5.1%) and Europe (3.4%).
Trade growth this year could fall short of estimates if some downside risks emerge, including financial turbulence in emerging markets related to the conduct of monetary policy in the United States and other developed countries. Better than expected growth in the US could actually provoke further instability in developing economies as it might be interpreted as portending earlier interest rate rises. This in turn could trigger further capital outflows from the developing world as investors seek improved returns in developed countries. However, the prospect of deflation in the euro area suggests that monetary policy in developed countries could as easily become looser rather than tighter.
Table 4: World merchandise trade and GDP, 2010-2015a
Annual % change

a Figures for 2014 and 2015 are projections. b Other regions comprises the Africa, CIS and Middle East
Source: WTO Secretariat for trade, concensus estimates for GDP.
References
[1] The Evolution of international economic order, William Arthur Lewis, 2010, Princenton University Press
[3] Succesfully austery in the United States, Europe and Japan, N.Batini, G.Callegary ang G.Melina, July 2012
[4] Unemployment in the Great Recession: A comparisson of Germany, Canada and the United States, F. Hoffman, T. Lemieux, 2014
[6] Enlargement and the EU Periphery: The Impact of Changing Market Potential, Marius Brülhart , Matthieu Crozet and Pamina Koenig, 2012
[7] Challenges for Japan’s Fiscal Consolidation, Kazuyuki Sugimoto and Junji Ueda, October 2013
[8] GDP Prediction The World Bank
[9] At risk: natural hazards, people vulnerability and disasters, Second Edition, Ben Wisner, 2014
[10] A COMPREHENSIVE STUDY OF INDIA’S CURRENT ACCOUNT DEFICIT AND THE NEED TO REDUCE IT, Dr. Charan Singh, 2014
[11] Turkey’s Current Account Deficit Problem and Its Effects on the European Union Accession, Osman Zekayi ORHAN, ve Ebru NERGİZ, 2014
[12] Un análisis de los desequilibrios del tipo de cambio real argentino bajo cambios de régimen, Daniel Abdomen, 2014
[13] Dependence on Middle East energy and its impact on global security, 2014
[14] WTO Statistics

Well Compiled.
LikeLiked by 1 person
Thanks! 🙂
LikeLike